Examples for general profile shapes
[1]:
from shape_generator import CrossSection, circle, csv
Example for standard egg cross section
[2]:
profile_dimensions = csv("""
label,name,r
P0,0,30
P1,1,35
P2,2,40
P3,3,45
P4,4,50
P5,5,55
P6,6,60
P7,6a,65
""")
unit = 'cm'
profile_dimensions
[2]:
| name | r | |
|---|---|---|
| label | ||
| P0 | 0 | 30 |
| P1 | 1 | 35 |
| P2 | 2 | 40 |
| P3 | 3 | 45 |
| P4 | 4 | 50 |
| P5 | 5 | 55 |
| P6 | 6 | 60 |
| P7 | 6a | 65 |
[3]:
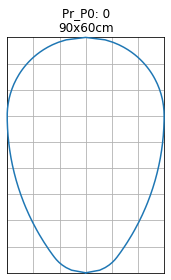
label = 'P0'
name, r = profile_dimensions.loc[label].values
R = 3 * r
roh = r / 2
height = r * 3
width = r * 2
# h1 = roh - (r + roh) / (R - roh) * roh
h1 = r/ 5

cross_section = CrossSection(label=label, long_label=name, width=width, height=height, unit=unit)
cross_section.add(circle(roh, x_m=roh))
cross_section.add(h1)
cross_section.add(circle(R, x_m=2 * r, y_m=-(R - r)))
cross_section.add(2 * r)
cross_section.add(circle(r, x_m=2 * r))
______________________________
Pr_P0  ->  0
[4]:
cross_section.generator(show=True)
0 :  sqrt(-(x - 15.0)**2 + 225.0)
1 :  (6.0, None)
2 :  sqrt(-(x - 60.0)**2 + 8100.0) - 60.0
3 :  (60.0, None)
4 :  sqrt(-(x - 60.0)**2 + 900.0)
            x          y
0    0.000000   0.000000
1    1.000000   5.385165
2    2.000000   7.483315
3    3.000000   9.000000
4    4.000000  10.198039
5    5.000000  11.180340
6    6.000000  12.000000
7    6.947368  12.700613
8    7.894737  13.383029
9    8.842105  14.046330
10   9.789474  14.691736
11  10.736842  15.320361
12  11.684211  15.931312
13  12.631579  16.526287
14  13.578947  17.104415
15  14.526316  17.666694
16  15.473684  18.214035
17  16.421053  18.745608
18  17.368421  19.262302
19  18.315789  19.764931
20  19.263158  20.252706
21  20.210526  20.726919
22  21.157895  21.186816
23  22.105263  21.633137
24  23.052632  22.066553
25  24.000000  22.486363
26  24.947368  22.893228
27  25.894737  23.287748
28  26.842105  23.669272
29  27.789474  24.038393
..        ...        ...
66  62.812500  29.867920
67  63.750000  29.764702
68  64.687500  29.631447
69  65.625000  29.467938
70  66.562500  29.273540
71  67.500000  29.047375
72  68.437500  28.788889
73  69.375000  28.497533
74  70.312500  28.172019
75  71.250000  27.810744
76  72.187500  27.412637
77  73.125000  26.976552
78  74.062500  26.500192
79  75.000000  25.980762
80  75.937500  25.416140
81  76.875000  24.803919
82  77.812500  24.139856
83  78.750000  23.418742
84  79.687500  22.635871
85  80.625000  21.785531
86  81.562500  20.858575
87  82.500000  19.843135
88  83.437500  18.725922
89  84.375000  17.488836
90  85.312500  16.102877
91  86.250000  14.523688
92  87.187500  12.681193
93  88.125000  10.439558
94  89.062500   7.443128
95  90.000000   0.000000

[96 rows x 2 columns]
[5]:
cross_section.df_abs
[5]:
| x | y | |
|---|---|---|
| 0 | 0.000 | 0.000 |
| 1 | 0.999 | 5.382 |
| 2 | 1.998 | 7.479 |
| 3 | 2.997 | 9.000 |
| 4 | 3.996 | 10.197 |
| 5 | 5.004 | 11.178 |
| 6 | 6.003 | 11.997 |
| 7 | 6.948 | 12.699 |
| 8 | 7.893 | 13.383 |
| 9 | 8.838 | 14.049 |
| 10 | 9.792 | 14.688 |
| 11 | 10.737 | 15.318 |
| 12 | 11.682 | 15.930 |
| 13 | 12.636 | 16.524 |
| 14 | 13.581 | 17.100 |
| 15 | 14.526 | 17.667 |
| 16 | 15.471 | 18.216 |
| 17 | 16.425 | 18.747 |
| 18 | 17.370 | 19.260 |
| 19 | 18.315 | 19.764 |
| 20 | 19.260 | 20.250 |
| 21 | 20.214 | 20.727 |
| 22 | 21.159 | 21.186 |
| 23 | 22.104 | 21.636 |
| 24 | 23.049 | 22.068 |
| 25 | 24.003 | 22.482 |
| 26 | 24.948 | 22.896 |
| 27 | 25.893 | 23.292 |
| 28 | 26.838 | 23.670 |
| 29 | 27.792 | 24.039 |
| ... | ... | ... |
| 66 | 62.811 | 29.871 |
| 67 | 63.747 | 29.763 |
| 68 | 64.692 | 29.628 |
| 69 | 65.628 | 29.466 |
| 70 | 66.564 | 29.277 |
| 71 | 67.500 | 29.043 |
| 72 | 68.436 | 28.791 |
| 73 | 69.372 | 28.494 |
| 74 | 70.308 | 28.170 |
| 75 | 71.253 | 27.810 |
| 76 | 72.189 | 27.414 |
| 77 | 73.125 | 26.973 |
| 78 | 74.061 | 26.496 |
| 79 | 74.997 | 25.983 |
| 80 | 75.942 | 25.416 |
| 81 | 76.878 | 24.804 |
| 82 | 77.814 | 24.138 |
| 83 | 78.750 | 23.418 |
| 84 | 79.686 | 22.635 |
| 85 | 80.622 | 21.789 |
| 86 | 81.558 | 20.862 |
| 87 | 82.503 | 19.845 |
| 88 | 83.439 | 18.729 |
| 89 | 84.375 | 17.487 |
| 90 | 85.311 | 16.101 |
| 91 | 86.247 | 14.526 |
| 92 | 87.192 | 12.681 |
| 93 | 88.128 | 10.440 |
| 94 | 89.064 | 7.443 |
| 95 | 90.000 | 0.000 |
96 rows × 2 columns
[6]:
fig = cross_section.profile_abs_figure()
Example for custom cross section
[7]:
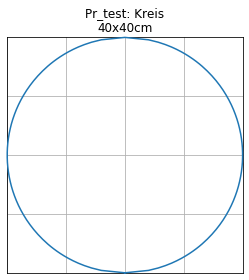
no = 'test'
name = 'Kreis'
r = 20  # cm
unit = 'cm'

kreis = CrossSection(label=no, long_label=name, height=2*r, unit=unit)
kreis.add_and_show(circle(r, x_m=r))
______________________________
Pr_test  ->  Kreis
-----
sqrt(-(x - 20.0)**2 + 400.0)
-----
[8]:
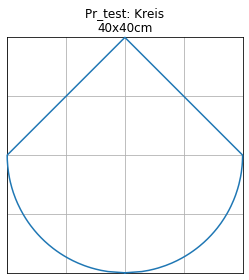
kreis.add_and_show(r,r)
-----
sqrt(-(x - 20.0)**2 + 400.0)
(20.0, 20.0)
-----
[9]:
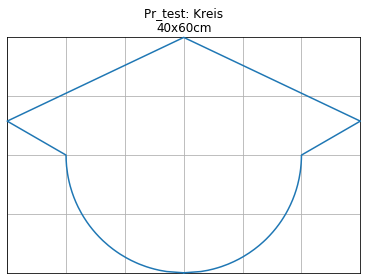
kreis.add_and_show(30, '°slope')
-----
sqrt(-(x - 20.0)**2 + 400.0)
(20.0, 20.0)
(0.57735, 'slope')
-----
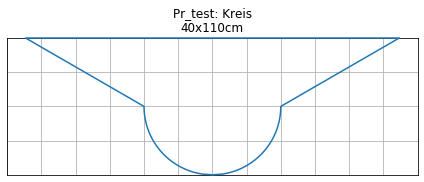
[10]:
kreis.add_and_show(None,1.5*r)
-----
sqrt(-(x - 20.0)**2 + 400.0)
(20.0, 20.0)
(0.57735, 'slope')
(None, 30.0)
-----